
Crash data
photo credit: zubin stillings
The MPO works with the University of New Mexico Traffic Research Unit to obtain annual crash data for the metropolitan planning area. The MPO shares the data with local representatives and agency staff to inform transportation projects throughout the MPO area.
Table of Contents
2024 Crash Data
The below interactive crash map is provided by the UNM Traffic Research Unit. You can also view it in your browser.
How to use this map:
- Either scroll within the map to find your area of interest, or navigate to the “Crash Filter” below the map to filter by region.
- Filter by crash severity or date below the map.
- The crash factor bar charts at the bottom are interactive; click the bars to show or remove crashes with those factors.
- Click “Density Map” to open the hot spot map in a new window.
2012-2021 Crash Map
The below interactive crash map is hosted by the UNM Earth Data Analysis Center and the Center for Pedestrian and Bicyclist Safety. The data are aggregated in a hex pattern that gets smaller the more you zoom in to display the density of crashes.
How to use this map:
- Zoom into Santa Fe by double clicking or using the zoom symbol (+) in the upper left corner.
- Select the desired year and/or desired mode involved in the crash (pedestrian, bicycle, vehicle).
- For more detailed instructions, click “User Guide” in the top panel on the right.
THE DEFAULT DISPLAY YEAR IS 2012.
Local Road Safety Plan 2015-2019 Crash Analysis
The Santa Fe Local Road Safety Plan did a number of crash analyses on 2015-2019 crash data. These analyses looked specifically at crash factors such as:
- speeding
- roadway departure
- distracted driving
- impaired driving
- occupant restraint
- older and younger drivers
- and vulnerable road users.
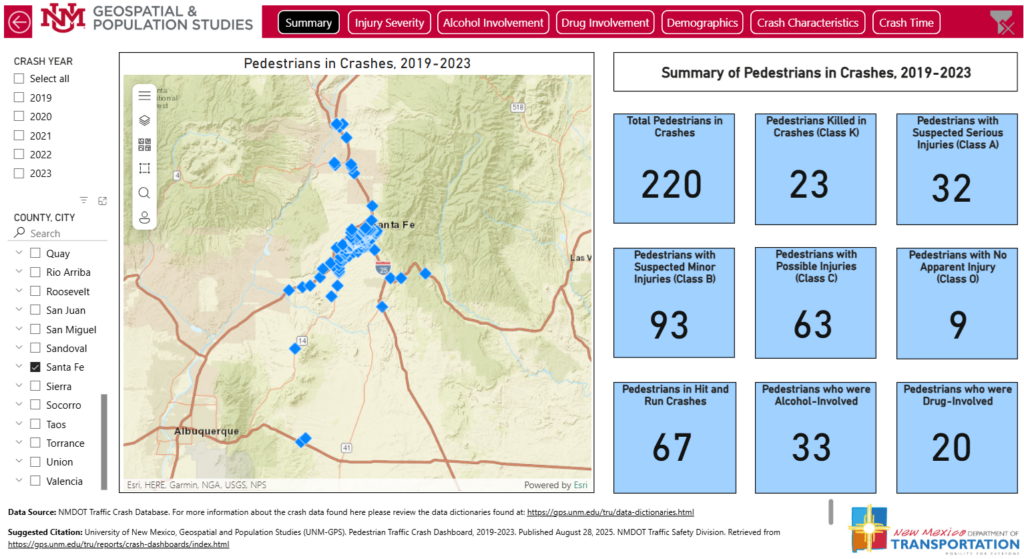
UNM Pedestrian & Cyclist Crash Dashboard 2019-2023
The UNM Geospatial and Population Studies created interactive pedestrian and cyclist (“pedalcyclist”) crash dashboards for crashes from 2019-2023. These dashboards and other crash reports are available on their website.
The New Mexico Department of Transportation Highway Safety Improvement Program (HSIP) created the dashboard below focused on bicycle and pedestrian fatal and serious injuries. Use the interactive map or the categories at the top to select for your area of interest and the information panel on the left will update to your selected area.
HSIP Vulnerable User Dashboard 2012-2023
Use the arrows on the bottom panels to explore more information about the crashes in the selected area.